Connecting Redis to Grafana
Understanding Redis - Part 5
tl;dr;
Grafana is an open source visualization tool that can help us visualize redis metrics.DISCLAIMER:
This is a long-ish post as it also covers some aspects of docker networking and docker compose
While using the cli to get these values is handy, getting these metrics one by one, or getting them for a number of machines, or for a cluster is quite annoying. you will usually find some or the other visualization software to see these values as graphs. These tools also help us see time based trends.
We will use Grafana for this post, which is free and has redis connectors available.
Also Grafana has Docker images available. 😊 So we will use that.
Get the Grafana image
Lets first pull the Grafana image from the public docker registry.
docker pull grafana/grafanaYou can find more about different docker images for Grafana on their official site
Run the Grafana image
Run an instance of grafana using this command.
docker run -d -p 3000:3000 grafana/grafanaOnce the container starts, go to http://localhost:3000/ to see the grafana dashboard.
The default username and password is admin.
Add the Redis connector plugin
Grafana does not ship with a Redis connector by default. However their is a community plugin that is useful. More details on the official site
The plugin can be installed by passing an argument to the docker run command.
The grafana image exposes a build argument called GF_INSTALL_PLUGINS which can be used to install the plugin at runtime.
The below plugin does it.
docker run -d -p 3000:3000 --name grafana -e "GF_INSTALL_PLUGINS=redis-datasource" grafana/grafanaValidate the Redis connector is present
Go to http://localhost:3000/datasources.
You should see a Add data source button like below.

Search for redis in the search bar
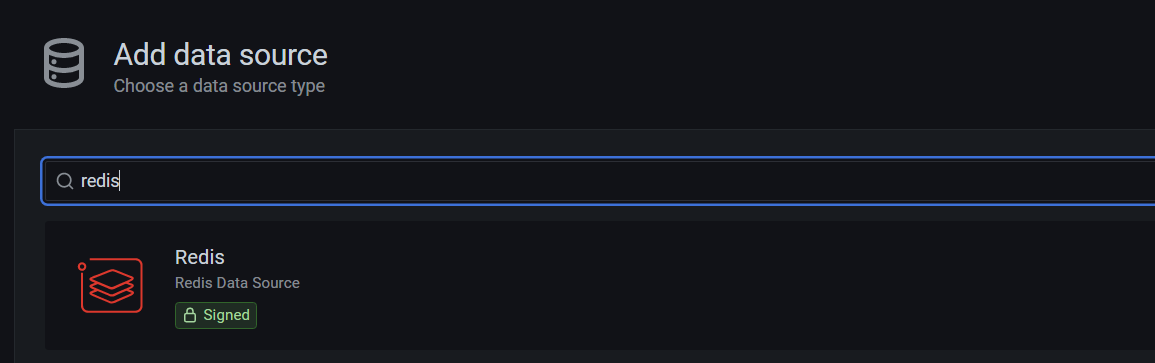
You should see a connector like shown in the image above.
A short note on docker networking
Before we connect to our redis instance, a short note on how docker networks work. Docker containers are very isolated from their hosts, unless you configure them to behave differently.
So if you just write docker run -d grafana/grafana instead of docker run -d -p 3000:3000 grafana/grafana, you wont be able to see the grafana UI, even though inside the container grafana ui code is still running.
When we specify -p or --port parameter, it tell docker to map the container port number to the host port number.
That way, when we say -p 3000:3000, dockers maps port 3000 of host system (your computer) to the port 3000 of the container. So when you open the http://locahost:3000 link in the browser, the request is routed to the container’s port 3000 and you get the response.
Connecting redis instance to grafana
Open http://localhost:3000/datasources and search for redis again.
Select the redis connector and fill in http://localhost:6379 (our redis instance’s port) in the address field and click Save & Test.
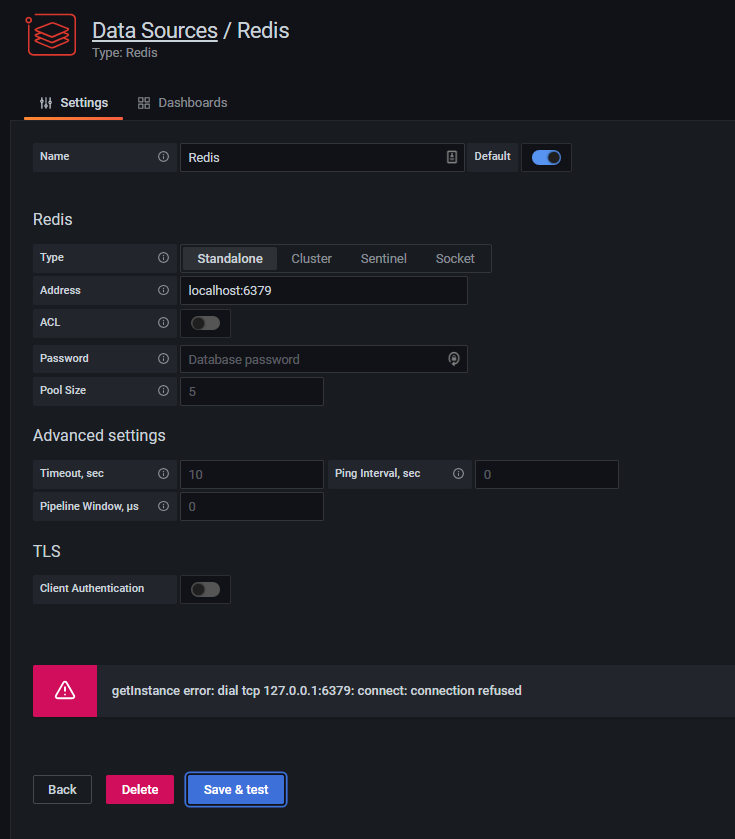
Lets understand the error by analyzing the sequence of events.
- Grafana code is running inside the container.
- You map the container port to host port 3000 so that you can see the UI.
- In the connector form, you enter
http://localhost:6379as your redis address. - The grafana code inside the container get a message that redis is located at
http://localhost:6379. - Grafana code inside the container tries to connect to redis on port
6379in its localhost (inside the container , not on your system) - Grafana code does not find a redis instance on its own local 6379 port and gives the error.
This means that even if you exposed your redis instance’s port to your host machine using
docker run --rm -p 6379:6379/TCP --name test-redis-instance redis, it still wont work. I tried. It didn’t.
I was also a bit confused at this point. After reading the docker networking tutorial here and explanation of bridge networks here, here is a way to do it.
Connecting redis instance to grafana [The hard way]
So we first have to locate the redis instance from the viewpoint of the grafana container.
Since redis is not running inside the grafana container, it means both containers should be connected by some network.
By default standalone containers connect to a docker network called bridge. This network acts as a liaison between the host and docker containers. (Helps move traffic, forward request, return data etc.). We just need to find the IP of the redis instance in the bridge network.
To do that, open another powershell window and run
docker network inspect bridgeThis prints a JSON.
Look for a section called Containers.
...
"Containers": {
    "71df1fb060baeb221cb01b78e3c60717934fa...": {
        "Name": "test-redis-instance",
        "EndpointID": "cefcf5c80fed007b...",
        "MacAddress": "....",
        "IPv4Address": "172.17.0.3/16",
        "IPv6Address": ""
    },
    "d22e95f9ee297e66839d93b9e41afdd367169...": {
        "Name": "grafana",
        "EndpointID": "e56d45454e56562a...",
        "MacAddress": "....",
        "IPv4Address": "172.17.0.4/16",
        "IPv6Address": ""
    }
}
...
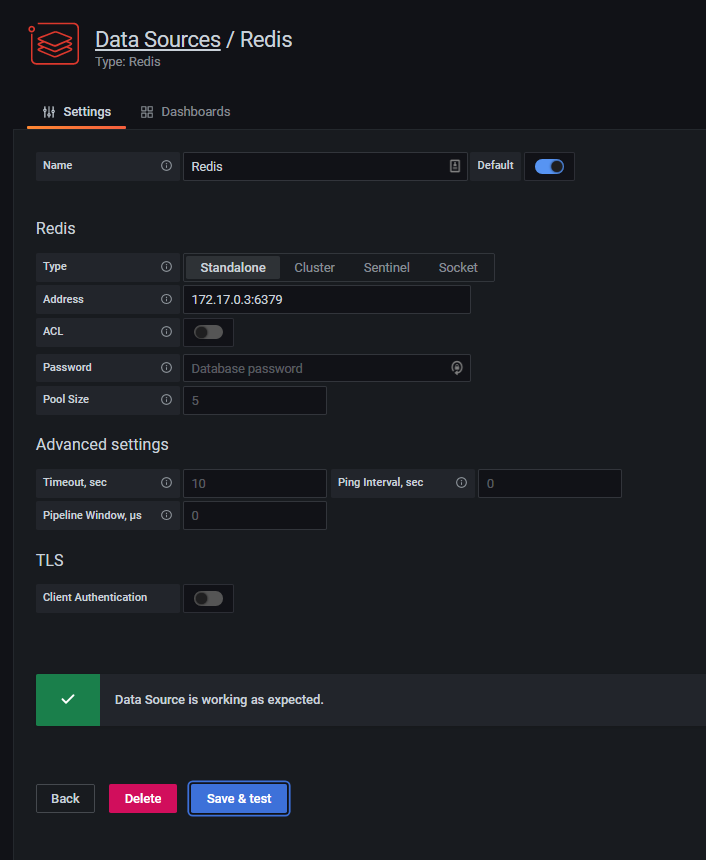
Copy the IPv4Address for the test-redis-instance container. In my case it is 172.17.0.3.
Now in the grafana UI, use this IP along with the port 6379, as the address of the redis instance 172.17.0.3:6379
Connecting redis instance to grafana [The easy way]
Finding the IP addresses like this is annoying and error prone.
Docker has something called Docker Compose that lets use write multi container docker applications nicely.
To do this create a folder named floozy (this name does not matter)
inside the folder create four files
|- floozy
    |--- docker-compose.yml
    |--- redis.DockerFile
    |--- grafana.DockerFile
    |--- .env
| File | Usage |
|---|---|
| docker-compose.yml | Starts up multiple containers and connects them |
| redis.DockerFile | Describes how to build the redis container |
| grafana.DockerFile | Describes how to build the grafana container |
| .env | Sets some environment variables |
DockerFile is used to create custom images based on some base images. Read more about Dockerfile on their official site
redis.DockerFile
Since we did not do any customization on top of redis image, this file can just have this
FROM redisThis is basically saying use the default redis image.
grafana.DockerFile
Remember we had to install the redis connector plugin on the base grafana image. Now we can do it in the DockerFile
# Take the base grafana image
FROM grafana/grafana:latest
# Set the GF_INSTALL_PLUGINS environment variable so that the plugin is installed
ENV GF_INSTALL_PLUGINS=redis-datasource
docker-compose.yml
# Use version 2 of the compose formal
version: '2'
# Define custom network.
# So that we can clearly analyse what is going on.
# Also so that our containers are unaffected by other things
networks:
    # Alias for the network
    cache:
        # Explicitly specifying the name of the network
        name: cache

# This is the list of services/containers to run
services:
    # This is the definition for our redis container
    redis-instance:
        # This part tells docker how to build the redis container
        build:
            # This is the directory
            # where docker will look
            # for the dockerfile specified below
            context: .
            # The docker file that has the definition for the image
            dockerfile: redis.DockerFile
        # Add this container to the cache network created above
        networks:
            - cache

    # This is the definition for our grafana container
    grafana-ui:
        # Map the 3000 port to
        # the host system so that
        # you can view the UI in the browser
        ports:
            - "3000:3000"
        # Same as redis
        build:
            context: .
            dockerfile: grafana.DockerFile
        # Same as redis
        networks:
            - cache
.env
This sets the environment variables.
By default when you use docker compose to create containers, it prefixes the names of the containers with the name of the folder. I find that annoying at times. you can set an environment variable called COMPOSE_PROJECT_NAME which will be used as prefix.
In .env file.
COMPOSE_PROJECT_NAME=understanding-redis
When all this is done, navigate to floozy folder and run
docker compose up -d --build
You will see a lot of logs similar to the ones you see when downloading a new docker image. This is docker compose building the docker files and creating containers for you. You should see something like below on the cli
- Network cache                                   Created
- Container understanding-redis_redis-instance_1  Started
- Container understanding-redis_grafana-ui_1     Started
Run docker ps to see the containers.
But why all this setup?
The advantage of docker compose is that it lets containers locate and refer to each other by their names/aliases instead of IP addresses.
So now instead of finding the IP of redis instance the hard way, you can just say redis-instance as the host name.
In the grafana UI at http://localhost:3000/datasources, replace the ip address with just redis-instance:6379
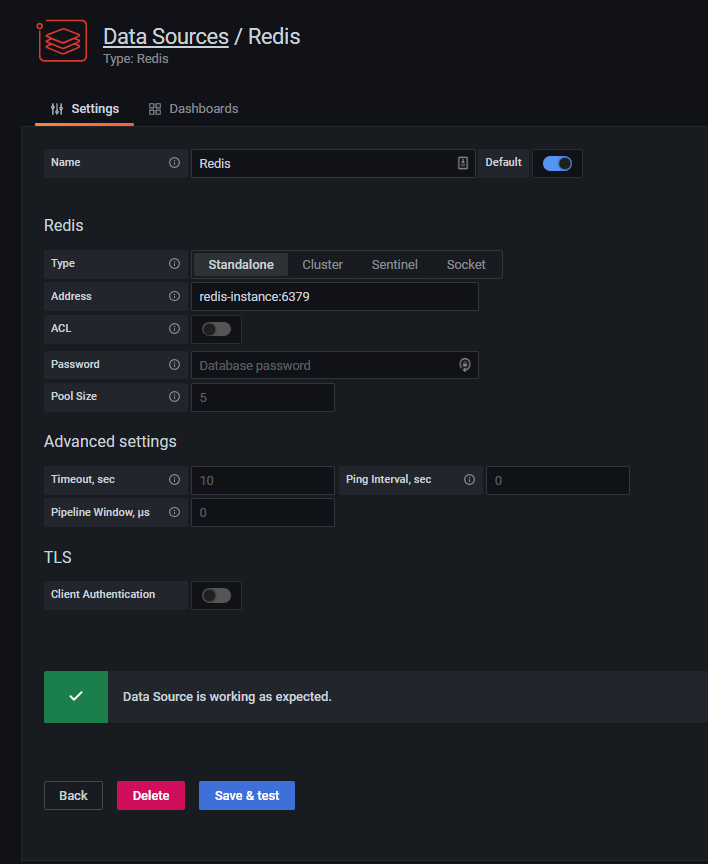 The connection succeeds.
From now on we will try to use docker compose wherever possible, when we need communication between containers.